Interviews: Reporting#
This page covers how to write up interview studies, including methods structure, quotes, demographics, reporting ranges, and saturation.
Reporting#
Reporting interviews in method sections.
For documenting analysis decisions before writing up results, see the Data Analysis Plan. For reporting and packaging publishable study materials, see Replication & Artifacts.
Writing Style#
When reporting interviews, always keep in mind that the results are:
- Not from a representative sample of a population, but from a small subset of people who shared their subjective experiences with you.
- Based on self-report, which may be subject to various biases, including over- and under-reporting, sample bias, and social-desirability bias.
In practice this means writing in a way that does not suggest any quantitative or generalized results, but rather describes the experiences of the participants in your study:
- Suggests a generalizable result that applies to “most developers”, which is not supported by the sample.
- Also turns self-reported behavior into an objective fact (“do not run SCA tools regularly”), which is not supported by the method.
- Qualifies the statement with “most of our participants” + number (see also Reporting Ranges below).
- Keeps it as self-reported behavior (“mentioned that they”).
Writing like this can feel a bit awkward at first, but generally you want to almost always include “participants” or “developers in our study” or similar qualifiers, as well as avoid turning self-reported behavior into objective facts and instead include qualifiers like “mentioned that they” or “reported that they” or similar.
Interview Method Section Checklist#
As a subsection of a paper, an interview method section should usually cover:
- Purpose and approach
- Recruitment and eligibility
- Participant demographics
- Interview procedure
- Data analysis
- Ethical considerations and data protection
- Limitations
Example Structure#
Example structure for the method section of an interview publication. You can copy and paste this structure to your publications as comments, and fill-in your own approach below each line.
Copy-Paste Version (for your LaTeX methodology file)
%% Purpose and Approach
% - Between June and August 2021, we conducted a semi-structured interview study with XX developers of background Y.
% - We invited XX participants.
% - See also Table~\ref{tab:interview} for a summary of our interview participants.
%% Participant Recruitment
% - Total number of interviewees
% - Eligibility criteria
% - How did we recruit on GitHub (?), screening questions on GitHub (if any?)
% - How did we select & why is this a good idea for our target population
% - Describe who we kicked out and why
% - Mitigations for biases if any
%% Demographics
% - Data dump of age, gender, experience, race, location, education etc. refer to appendix for detailed information, recruitment from where?
% - Experience and type of experience of participants, industries people worked in
% - See also Table~\ref{tab:demo} for participants' demographics.
%% Interview Procedure
% - Screening responses, survey for demographics
% - Semi-structured interviews
% - Explain why interviews
% - Explain how we developed interview guide and cheat sheet + source, adapted
% - Explain that research questions from prior work, addressing the problems described in previous sections, crafted questions to answer them
% - Developed and refined interview script (pilot, reiteration after first 3, minor changes -> included), explain piloting of interview guide and that we included pilots
% - Include interview-guide-flow-figure
% - Big picture content of interview guide, summary of interview script (sections etc.); walk through the figure
% - Describe what we defined in the interview and what we didn't define and why and at which point
% - Describe if/that we initially interviewed one type of person then included other people people and why
% - Explain that we stopped when we reached saturation
%% Interview Data Analysis
% - Describe coding process at a high level
% - Mention volume of audio
% - Describe codebook development
% - Link to codebook in appendix
% - Coding process including conflict resolution in entail
%% Ethical Considerations and Data Protection
% - Approved by IRB
% - Consent form
% - Sensitive questions
% - Data protection stuff
% - Describe how participants were informed about the study/data collection/data usage
% - Consent form, including right to withdraw at any time, skip any questions they wished, answered all participants' data storage questions to their satisfaction
% - GDPR
% - Secure cloud collaboration
% - De-identified transcripts
% - Transcription provider was GDPR compliant
% - Fair payment
%% Limitations
% - Our work includes a number of limitations typical for this type of interview study and should be interpreted in context.
% - In general, self-report studies may suffer from several biases, including over- and under-reporting, sample bias, and social-desirability bias.
% - Convenience sample
% - Interview study
% - Sampling, upwork, skew young and male (which is common among these sites \cite{})
% - Mitigation for location bias
% - Maybe suggest future work that expands the scope of this study
Purpose and Approach#
- Between June and August 2021, we conducted a semi-structured interview study with XX developers of background Y.
- We invited XX participants.
- See also Table~\ref{tab:interview} for a summary of our interview participants.
Participant Recruitment#
- Total number of interviewees
- Eligibility criteria
- Where did we recruit
- How did we recruit (channel)
- Screening questions (if any?)
- How did we select & why is this a good idea for our target population
- Describe who we kicked out and why
- Mitigations for biases if any
Demographics#
- Data dump of age, gender, experience, race, location, education etc. refer to appendix for detailed information, recruitment from where?
- Experience and type of experience of participants, industries people worked in
- See also Table~\ref{tab:demo} for participants’ demographics.
Interview Procedure#
- Screening responses, survey for demographics
- Semi-structured interviews
- Explain why interviews
- Explain how we developed interview guide and cheat sheet + source, adapted
- Explain that research questions from prior work, addressing the problems described in previous sections, crafted questions to answer them
- Developed and refined interview script (pilot, reiteration after first 3, minor changes -> included), explain piloting of interview guide and that we included pilots
- Include interview-guide-flow-figure
- Big picture content of interview guide, summary of interview script (sections etc.); walk through the figure
- Describe what we defined in the interview and what we didn’t define and why and at which point
- Describe if/that we initially interviewed one type of person then included other people people and why
- Explain that we stopped when we reached saturation
Interview Data Analysis#
- Describe coding process at a high level
- Mention volume of audio
- Describe codebook development
- Link to codebook in appendix
- Coding process including conflict resolution in entail
Ethical Considerations and Data Protection#
- Approved by IRB / ethics board
- Consent form
- Sensitive questions
- Data protection stuff
- Describe how participants were informed about the study/data collection/data usage
- Consent form, including right to withdraw at any time, skip any questions they wished, answered all participants’ data storage questions to their satisfaction
- GDPR
- Secure cloud collaboration
- De-identified transcripts
- Transcription provider was GDPR compliant
- Fair payment
Limitations#
- Our work includes a number of limitations typical for this type of interview study and should be interpreted in context.
- In general, self-report studies may suffer from several biases, including over- and under-reporting, sample bias, and social-desirability bias.
- Convenience sample
- Interview study
- Sampling, upwork, skew young and male (which is common among these sites \cite{})
- Mitigation for location bias
- Maybe suggest future work that expands the scope of this study
For the paper-level method section scaffold that mirrors this checklist, see Paper Structure: Methods.
Quotes#
Use the csquotes package to include quotes in your paper.
This package provides a nice way to include quotes with proper formatting and citation.
LaTeX code for group style quotes
%%% Quotes %%%
% "threshold" is the number of lines after which a \blockquote changes from inline to a display
\usepackage[style=american,threshold=5,autopunct]{csquotes}
% Set textquotes as italic
\renewcommand{\mktextquote}[6]{%
% #1 The opening quotation mark.
% #2 The htexti argument of the command.
% #3 The closing quotation mark.
% #4 The optional hpuncti argument of the command. If there is no hpuncti argument, this parameter is empty.
% #5 Trailing htpuncti punctuation immediately after the command. If there is no such punctuation or if the autopunct feature is disabled, this parameter isempty
% #6 The optional hcitei argument of the command, wrapped in \mkcitation. If there is no hcitei argument, this parameter is empty. With integrated quotation commands, this parameter is the citation code, wrapped in \mkccitation.
    #1{\itshape #2}#4#3#6#5%
}
% For blockquotes
% \renewcommand\mkblockquote[4]{\leavevmode\llap{``}#1#2#3''#4}
\renewcommand{\mkblockquote}[4]{%
    % Redefine the cite formatting after the quote
    \renewcommand*{\mkcitation}[1]{ -~##1}
    % #1 The htexti argument of the command.
    % #2 The optional hpuncti argument of the command. If there is no hpuncti argument, this parameter is empty.
    % #3 Trailing htpuncti punctuation immediately after the command. If there is no such punctuation or if the autopunct feature is disabled, this parameter is empty.
    % #4 The optional hcitei argument of the command, wrapped in \mkcitation. If there is no hcitei argument, this parameter is empty. With integrated quotation commands, this parameter is the citation code, wrapped in \mkccitation.
    %\smallskip
    \vspace{-0.65em}
    \leavevmode\llap{\textooquote}{\itshape #1}\textcoquote#2#4#3%
    %\smallskip
    \vspace{-0.65em}
}
% for environments "displayquote" and related:
\renewcommand{\mkbegdispquote}[2]{\leavevmode\llap{``}}
\renewcommand{\mkenddispquote}[2]{''#1#2}
\renewcommand{\mktextdel}[1]{[\textellipsis\unkern]}
\newcommand{\spacebetweenblockquote}{\vspace{1pt}}
Use the dedicated quote commands with csquotes:
- General quote with participant identier:
\textquote[P18]{Quote content.} - Quote either rendered inline or as display quote depending on “threshold” in above script:
\blockquote[P18]{Quote content.} - Just quote marks (no reference field)_
\enquote{Quote content.}
For better kerning, use the more sophisticated interface of csquotes, i.e.,
\textelp{}for elipses ("…"")\textins{}for insertions “[] said”\textdel{}for deletions “Pigs can […] fly.”
Avoid plain TeX commands like [\ldots] that break layout and kerning.
Demographics#
For demographics tables see –> Tables.
Reporting Numbers#
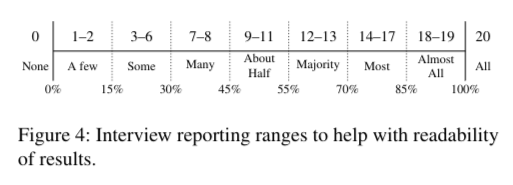
There has been a lot of discussion on whether or not you should report counts or percentages in a qualitative interview study - after all, you don’t want to suggest any quantitative or generalized results, as you “only” interviewed a small subset of a group on their subjective experiences.
The current group workflow in this case is to provide qualifiers, i.e., you select certain percentages ranges, assign them a qualifier term, and only use these to describe your results and the portions of participants who stated certain things.
LaTeX code for Interview Range Table
\begin{tikzpicture}
    \def\participants{20} % Number of participants
    % Define the spacing and length
    \def\spacing{2} % Distance between vertical lines
    \def\numLines{7} % Number of intervals for finer granularity
    \def\vertLength{1} % Length of vertical lines above and below the horizontal line

    % Calculate participant ranges for each segment based on percentages
    \pgfmathsetmacro{\none}{int(0)}
    \pgfmathsetmacro{\afew}{int(floor(\participants * 0.15))}
    \pgfmathsetmacro{\some}{int(floor(\participants * 0.30))}
    \pgfmathsetmacro{\many}{int(floor(\participants * 0.45))}
    \pgfmathsetmacro{\abouthalf}{int(floor(\participants * 0.55))}
    \pgfmathsetmacro{\majority}{int(floor(\participants * 0.70))}
    \pgfmathsetmacro{\most}{int(floor(\participants * 0.85))}
    \pgfmathsetmacro{\almostall}{int(floor(\participants * 0.99))}
    \pgfmathsetmacro{\all}{int(\participants)}
    % Precompute next lower bounds
    \pgfmathsetmacro{\noneplus}{int(\none + 1)}
    \pgfmathsetmacro{\afewplus}{int(\afew + 1)}
    \pgfmathsetmacro{\someplus}{int(\some + 1)}
    \pgfmathsetmacro{\manyplus}{int(\many + 1)}
    \pgfmathsetmacro{\abouthalfplus}{int(\abouthalf + 1)}
    \pgfmathsetmacro{\majorityplus}{int(\majority + 1)}
    \pgfmathsetmacro{\mostplus}{int(\most + 1)}
    \pgfmathsetmacro{\almostallplus}{int(\almostall + 1)}


    % Draw the horizontal line
    \draw[thick] (0, 0) -- (\numLines*\spacing, 0);

    % Loop to draw the vertical lines and percentage labels
    \foreach \i in {0,...,\numLines} {
        % Draw solid or dotted lines
        \ifnum\i=0
            \draw[thick] (\i*\spacing, -\vertLength) -- (\i*\spacing, \vertLength); % Solid line at 0%
        \else\ifnum\i=\numLines
            \draw[thick] (\i*\spacing, -\vertLength) -- (\i*\spacing, \vertLength); % Solid line at 100%
        \else
            \draw[thick, dotted] (\i*\spacing, -\vertLength) -- (\i*\spacing, \vertLength); % Dotted lines in between
        \fi\fi

    }

	% Percentage labels
	\node[below] at (0*\spacing, -\vertLength) {0\%};
    \node[below] at (1*\spacing, -\vertLength) {15\%};
    \node[below] at (2*\spacing, -\vertLength) {30\%};
    \node[below] at (3*\spacing, -\vertLength) {45\%};
    \node[below] at (4*\spacing, -\vertLength) {55\%};
    \node[below] at (5*\spacing, -\vertLength) {70\%};
    \node[below] at (6*\spacing, -\vertLength) {85\%};
    \node[below] at (7*\spacing, -\vertLength) {100\%};

    % Labels below
    \node at (-0.3*\spacing, -0.5*\vertLength) {None};		% Label for 0%
    \node at (0.5*\spacing, -0.5\vertLength) {A few};		% Label for 0-15%
    \node at (1.5*\spacing, -0.5*\vertLength) {Some};		% Label for 15-30%
    \node at (2.5*\spacing, -0.5*\vertLength) {Many};		% Label for 30-45%
    \node[align=center] at (3.5*\spacing, -0.5*\vertLength) {About\\Half};	% Label for 45-55%
    \node at (4.5*\spacing, -0.5*\vertLength) {Majority};	% Label for 55-70%
    \node at (5.5*\spacing, -0.5*\vertLength) {Most};		% Label for 70-85%
    \node[align=center] at (6.5*\spacing, -0.5*\vertLength) {Almost\\All};	% Label for 85-99%
    \node at (7.3*\spacing, -0.5*\vertLength) {All};		% Label for 100%

    % Add computed participant ranges above the descriptive labels with no overlap
    \node[font = {\Large}] at (-0.3*\spacing, 0.5*\vertLength) {\none};								% Range for None
    \node[font = {\Large}] at (0.5*\spacing, 0.5*\vertLength) {\noneplus--\afew};					% Range for A few
    \node[font = {\Large}] at (1.5*\spacing, 0.5*\vertLength) {\afewplus--\some};					% Range for Some
    \node[font = {\Large}] at (2.5*\spacing, 0.5*\vertLength) {\someplus--\many};					% Range for Many
    \node[font = {\Large}] at (3.5*\spacing, 0.5*\vertLength) {\manyplus--\abouthalf};			% Range for About Half
    \node[font = {\Large}] at (4.5*\spacing, 0.5*\vertLength) {\abouthalfplus--\majority};		% Range for Majority
    \node[font = {\Large}] at (5.5*\spacing, 0.5*\vertLength) {\majorityplus--\most};				% Range for Most
    \node[font = {\Large}] at (6.5*\spacing, 0.5*\vertLength) {\mostplus--\almostall};			% Range for Almost All
    \node[font = {\Large}] at (7.3*\spacing, 0.5*\vertLength) {\all};

    % \label{fig:interview-range}
\end{tikzpicture}
For easier in-text reporting you can also use the following macros:
LaTeX macros for number reporting in text
\newcommand{\totalInterviewNum}{20 }

% interview reporting ranges
\usepackage{xparse}
\usepackage{xstring}
\newcommand{\rangecap}[1]{%
  \IfValueTF{#1}{%
    \IfEqCase{#1}{%
      {1}{A few}%
      {2}{A few}%
      {3}{Some}%
      {4}{Some}%
      {5}{Some}%
      {6}{Some}%
      {7}{Many}
      {8}{Many}%
      {9}{About half}%
      {10}{About half}%
      {11}{About half}%
      {12}{The majority of}%
      {13}{The majority of}%
      {14}{Most}%
      {15}{Most}%
      {16}{Most}%
      {17}{Most}
      {18}{Almost all}
      {19}{Almost all}
      {20}{All}
    }[\textbf{Unknown Value}] % Default case
  }{\textit{No Value Given}}% If no value provided
  \ignorespaces % Suppress space after the command
}

\newcommand{\range}[1]{%
  \IfValueTF{#1}{%
    \IfEqCase{#1}{%
      {1}{a few}%
      {2}{a few}%
      {3}{some}%
      {4}{some}%
      {5}{some}%
      {6}{some}%
      {7}{many}
      {8}{many}%
      {9}{about half}%
      {10}{about half}%
      {11}{about half}%
      {12}{the majority of}%
      {13}{the majority of}%
      {14}{most}%
      {15}{most}%
      {16}{most}%
      {17}{most}
      {18}{almost all}
      {19}{almost all}
      {20}{all}
    }[\textbf{Unknown Value}] % Default case
  }{\textit{No Value Given}}% If no value provided
  \ignorespaces % Suppress space after the command
}
With these macros you can use numbers directly:
\range{3}turns into “some”\rangecap{7}turns into “Many” (capitalized version) etc.
Examples: Publications using this approach
- Context Matters: Qualitative Insights into Developers’ Approaches and Challenges with Software Composition Analysis as an example from our group.
- Everyone for Themselves? A Qualitative Study about Individual Security Setups of Open Source Software Contributors by Amft et al.
- Distrust of big tech and a desire for privacy: Understanding the motivations of people who have voluntarily adopted secure email by Usman et al.
- How Usable Are iOS App Privacy Labels? by Zhang et al.
- Exploring How Privacy and Security Factor into IoT Device Purchase Behavior by Emami-Naeini et al.
- “It’s a scavenger hunt”: Usability of Websites’ Opt-Out and Data Deletion Choices by Habib et al.
Saturation#
LaTeX code for Saturation Figure
\begin{figure}[tbp!]
\centering
\begin{tikzpicture}
% \centering
\begin{axis}[
width=0.67\linewidth,
line width=0.5,
grid=major, % Display a grid
tick label style={font=\scriptsize},
legend style={nodes={scale=0.4, transform shape}},
label style={font=\scriptsize},
legend image post style={mark=triangle},
grid style={white},
xlabel={Number of interviews},
ylabel={Number of subcodes},
y tick label style={
/pgf/number format/.cd,
fixed,
fixed zerofill,
precision=0
},
]
\addplot[blue] coordinates
{(1, 14) (2, 39) (3, 53) (4, 71) (5, 83) (6, 93) (7, 113) (8, 118) (9, 122) (10, 131) (11, 135) (12, 141) (13, 144) (14, 148) (15, 148) (16, 149) (17, 151) (18, 151) (19, 151) (20, 151)};
\end{axis}
\end{tikzpicture}
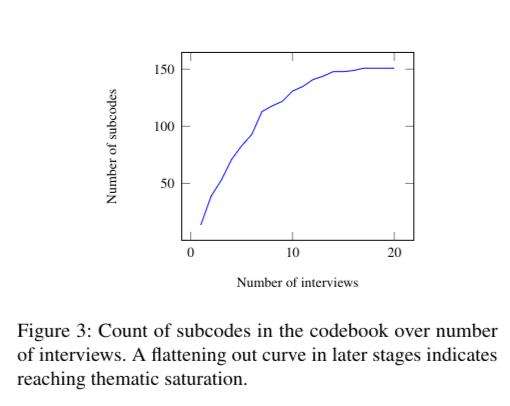
\caption{Count of subcodes in the codebook over number of interviews. A flattening out curve in later stages indicates reaching thematic saturation.}
\label{fig:saturation-table}
\end{figure}TiKZ figure to highlight saturation over increasing number of interviews.
Examples: Publications using this approach
- Context Matters: Qualitative Insights into Developers’ Approaches and Challenges with Software Composition Analysis as an example from our group.